
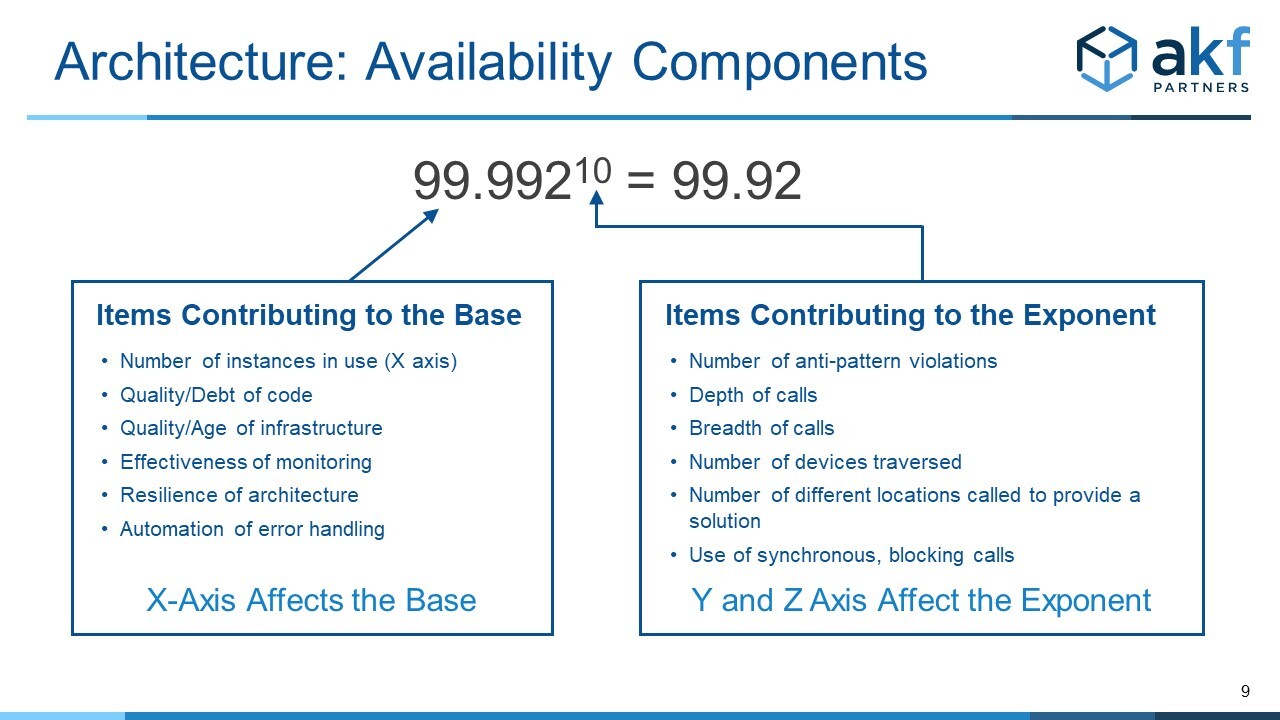
Our updated Availability Risk Model identified many risk drivers. The Risk tree showed components, but not the math to estimate downtime. We will highlight some aspects of the our Risk Model to show the likely ceiling of Availability.
Any service you create or consume is unlikely to exceed 99.99% availability. Yes, only Four 9s.
We will use some basic math and assumptions. The basic math we will use will not be 100% accurate, but close enough. As in 99.9% close enough.
These are the basic concepts that CTOs, engineers and product managers will need to know:
- Estimate downtime via expected uptime of each system
- Remember expected downtime for 99%, 99.9%, and 99.99% for a year or a month
- Components and communications that behave in series will lower your availability (number of 9s)
- Components and communications that behave in parallel will increase availability
- Identify what components of the architecture operate as series vs parallel communications
Expected Downtime via Expected Uptime
Our most mature clients have more robust ways of measuring availability. We will use actual calendar time for expected availability. Availability is the total uptime divided by the total possible time in a time period.
Our Anti-Patterns help identify where availability will be a problem (Y and Z above). Our Microservices Architecture Principles article walks through best practices.
Learn More
We cover these Availability topics and this example in all our public workshops. Yes, even those for Product Managers. Availability is a feature.
This YouTube video walks through this blog post and our AKF Availability Risk Model.
This Excel calculator walks through the above examples. The calculator shows the expanded version of each sub-component for you to adjust.
Contact us if you would like to learn more.